1
 2
 3
 4
 5
 6
 7
 8
 9
10
11
12
13
14
15
16
17
18
19
20
21
22
23
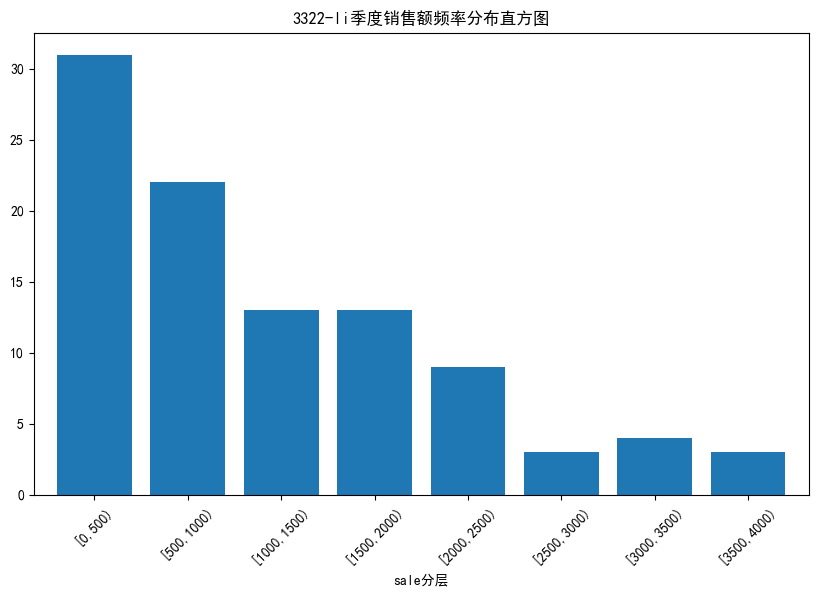
| # Read in data and designate 'Date' column as index
data = pd.read_excel("catering_fish_congee.xls",names=['date','sale'])
# Create bins (0-500, 500-1000, etc.)
bins = [0,500,1000,1500,2000,2500,3000,3500,4000]
labels = ['[0,500)','[500,1000)','[1000,1500)','[1500,2000)',
'[2000,2500)','[2500,3000)','[3000,3500)','[3500,4000)']
# Group data according to bins and compute the number of instances
data['sale分层'] = pd.cut(data.sale, bins, labels=labels) # Binning
aggResult = data.groupby(by=['sale分层'])['sale'].agg(np.size) # Aggregration
print(aggResult)
# Calculate percentage of each bin and show result
pAggResult = round(aggResult/aggResult.sum(), 2, ) * 100
print(pAggResult)
# Plot graph to visualize result
plt.figure(figsize=(10,6)) # Set figure size
pAggResult.plot(kind='bar',width=0.8,fontsize=10) # Draw frequency histogram
plt.title('3322-li季度销售额频率分布直方图',fontsize=12) # Set chart title
plt.xticks(rotation=45)
plt.show()
|